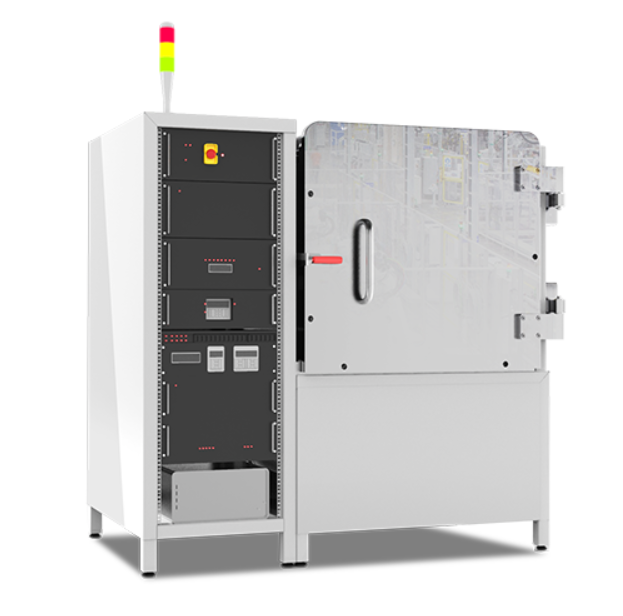
AttoMap-310
XRF Microscope Highest resolution XRF on the market Ambient and Vacuum (low-Z) Award Winning (Microscopy Today)
Highest Resolution of any XRF Microscope on the Market
Micro x-ray fluorescence (microXRF) as a technique provides excellent sensitivity for compositional analysis, with sensitivities typically 1000X that of electron-based spectroscopy (ppm vs. ppt). The major limitation for laboratory-based microXRF has been the spot sizes achievable, which are typically around 20-50 µm. Sigray AttoMap achieves the highest spatial resolutions available on the order of single digit micrometers (3-5 µm) through the use of Sigray’s proprietary x-ray focusing optics. These x-ray focusing optics are much higher in efficiency and produce far smaller spot sizes than the polycapillary optics used by other laboratory microXRFs.
Sub-ppm Sensitivities (Sub-Femtogram)
AttoMap achieves unprecedented sensitivities at absolute detection limits of sub-femtogram and relative detection limits of sub-parts per million. This enables microscopy of trace element distributions at good throughput. The system’s accuracy and speed are why the AttoMap has been adopted by leading semiconductor companies for monitoring processes involving trace-level dopants.
Energy Tunability for High Throughput and Sensitivities
X-ray fluorescence is highly dependent on the energy of the illuminating x-ray beam. Fluorescence cross-sections can vary by several orders of magnitude, as can be seen in the corresponding table of a select number of elements. Sigray’s AttoMap-310 provides easy software-selection of up to 5 target materials, including exotic target materials such as a silicon-based source and a gold-based source, to ensure the ultimate sensitivity for a broad range of elements. Other x-ray sources are limited to only a single x-ray target material, which only allows maximizing the sensitivity and throughput for a subset of materials.
A visual depiction of how significant the impact of energy tunability through x-ray source target selection can be seen in the image below, comparing an arsenopyrite sample imaged using a tungsten (W) target and a molybdenum (Mo) target.
